r.random()
ETH Zurich - 2020
MASDFAB
Tutors: Eleni Skevaki, Ioanna Mitropoulou, Dr. Petrus Petrus Aejmelaeus-Lindström
Description: Small coding exercise to get familiar with Python in Jupyter Notebook.
Title : "The getaway jellyfish"
Concept : The idea was to create an animated illustrational jellyfish that breathes, flies towards the top, dissapears and leaves a random mark on the water.
The jellyfish is composed by 3 coded parts : top part of the body, bottom part of the body and the lines. The top and bottom part are the same function with different parameters and change in a similar way. It is basically a nested function of radius-changing circles inside circle arrays. The bottom part is a mix of 2 definitions of line arrays. The first one is a horizontal random array of vertical lines, and the second one a horizontal random array of lines with random x.positions.
Other studies
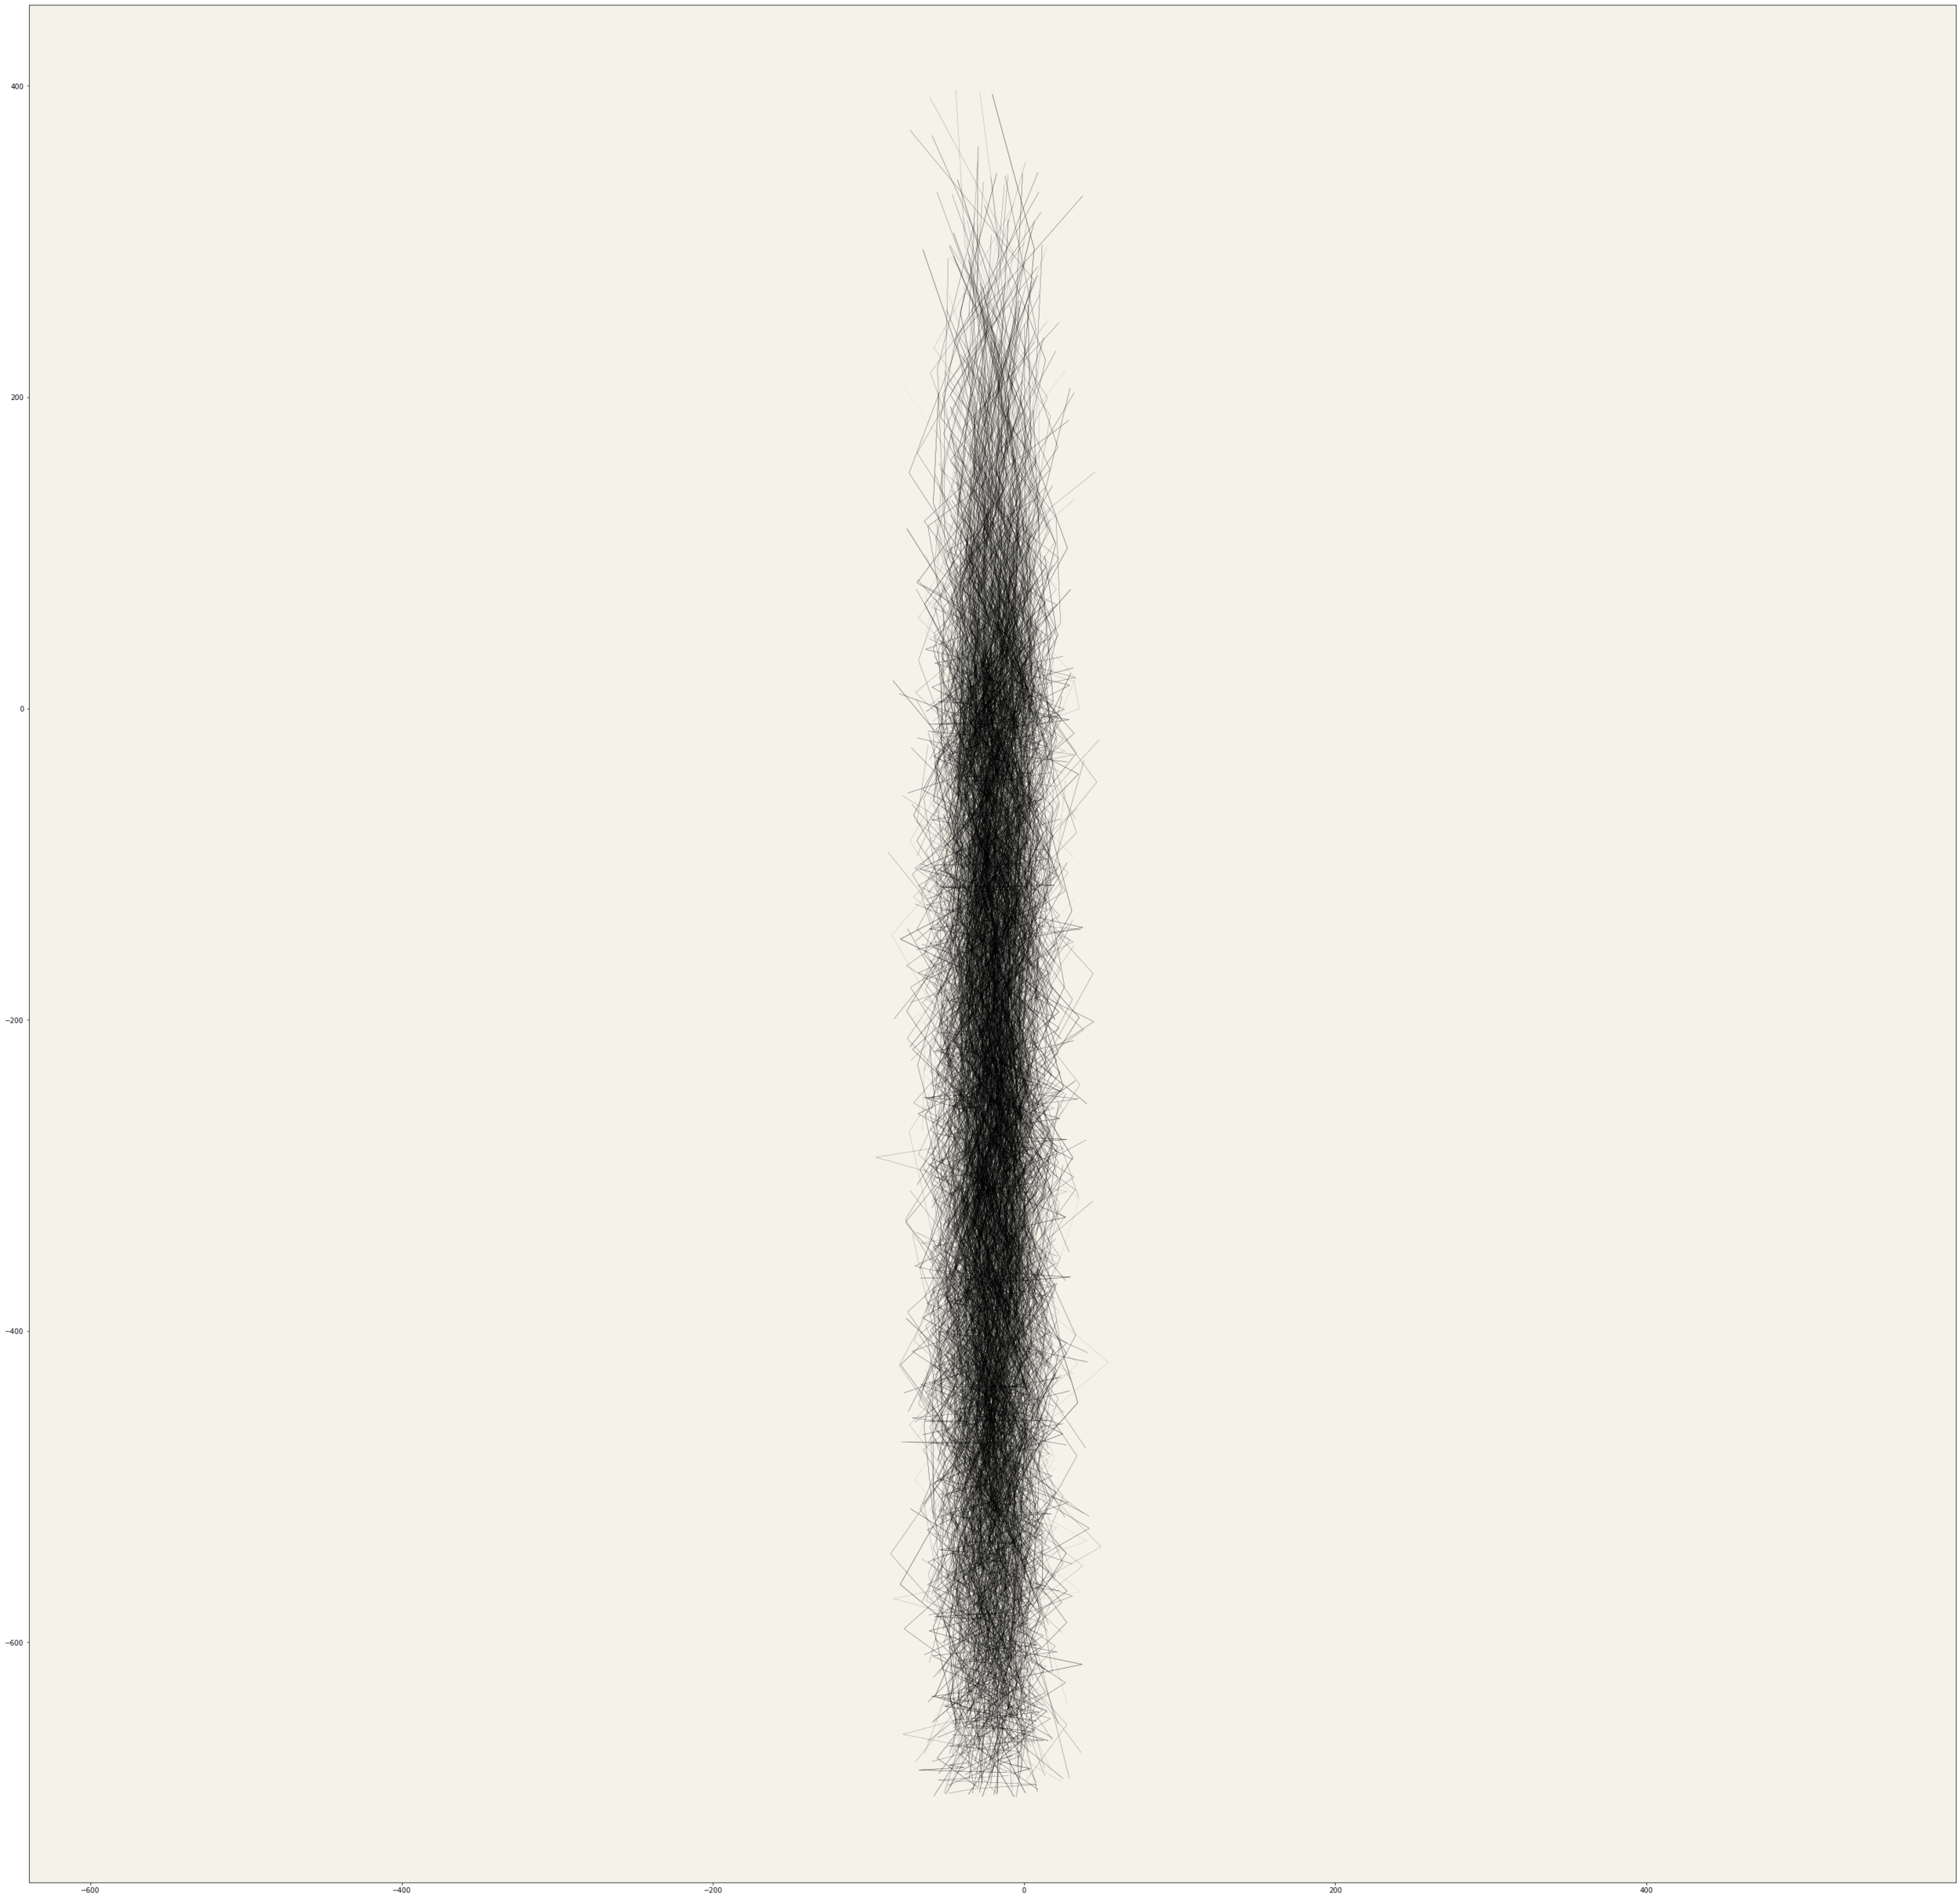
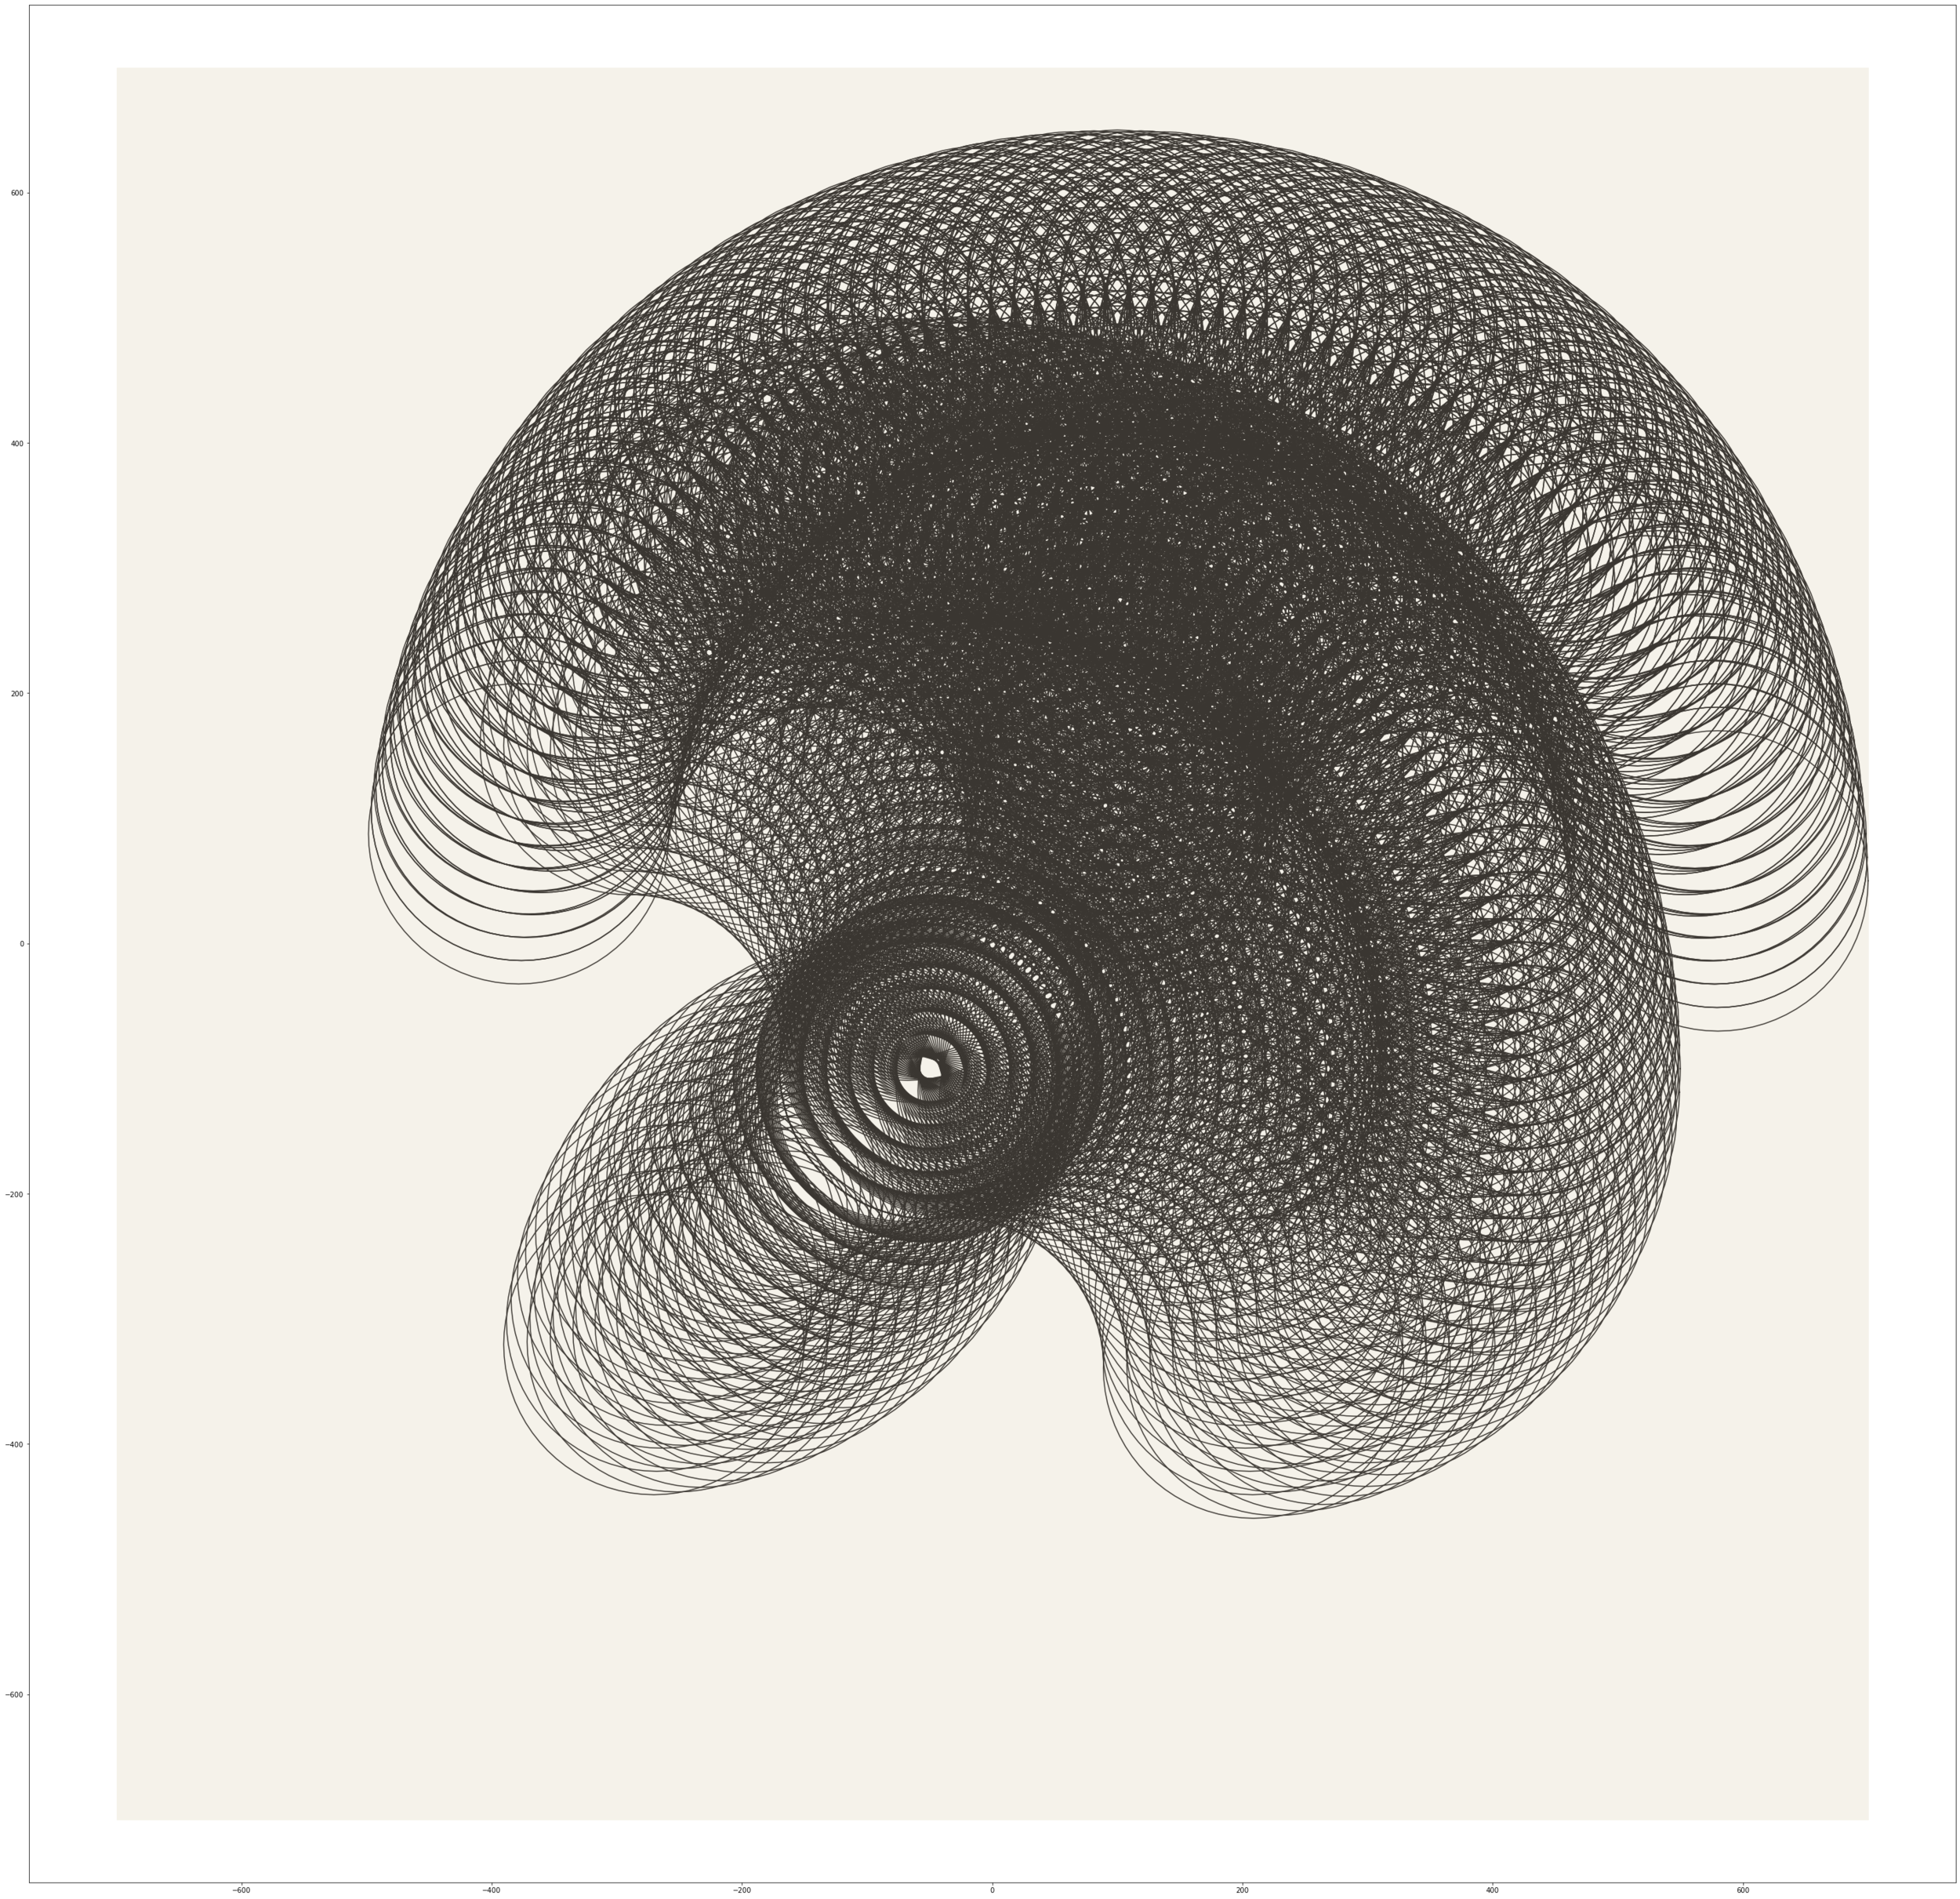

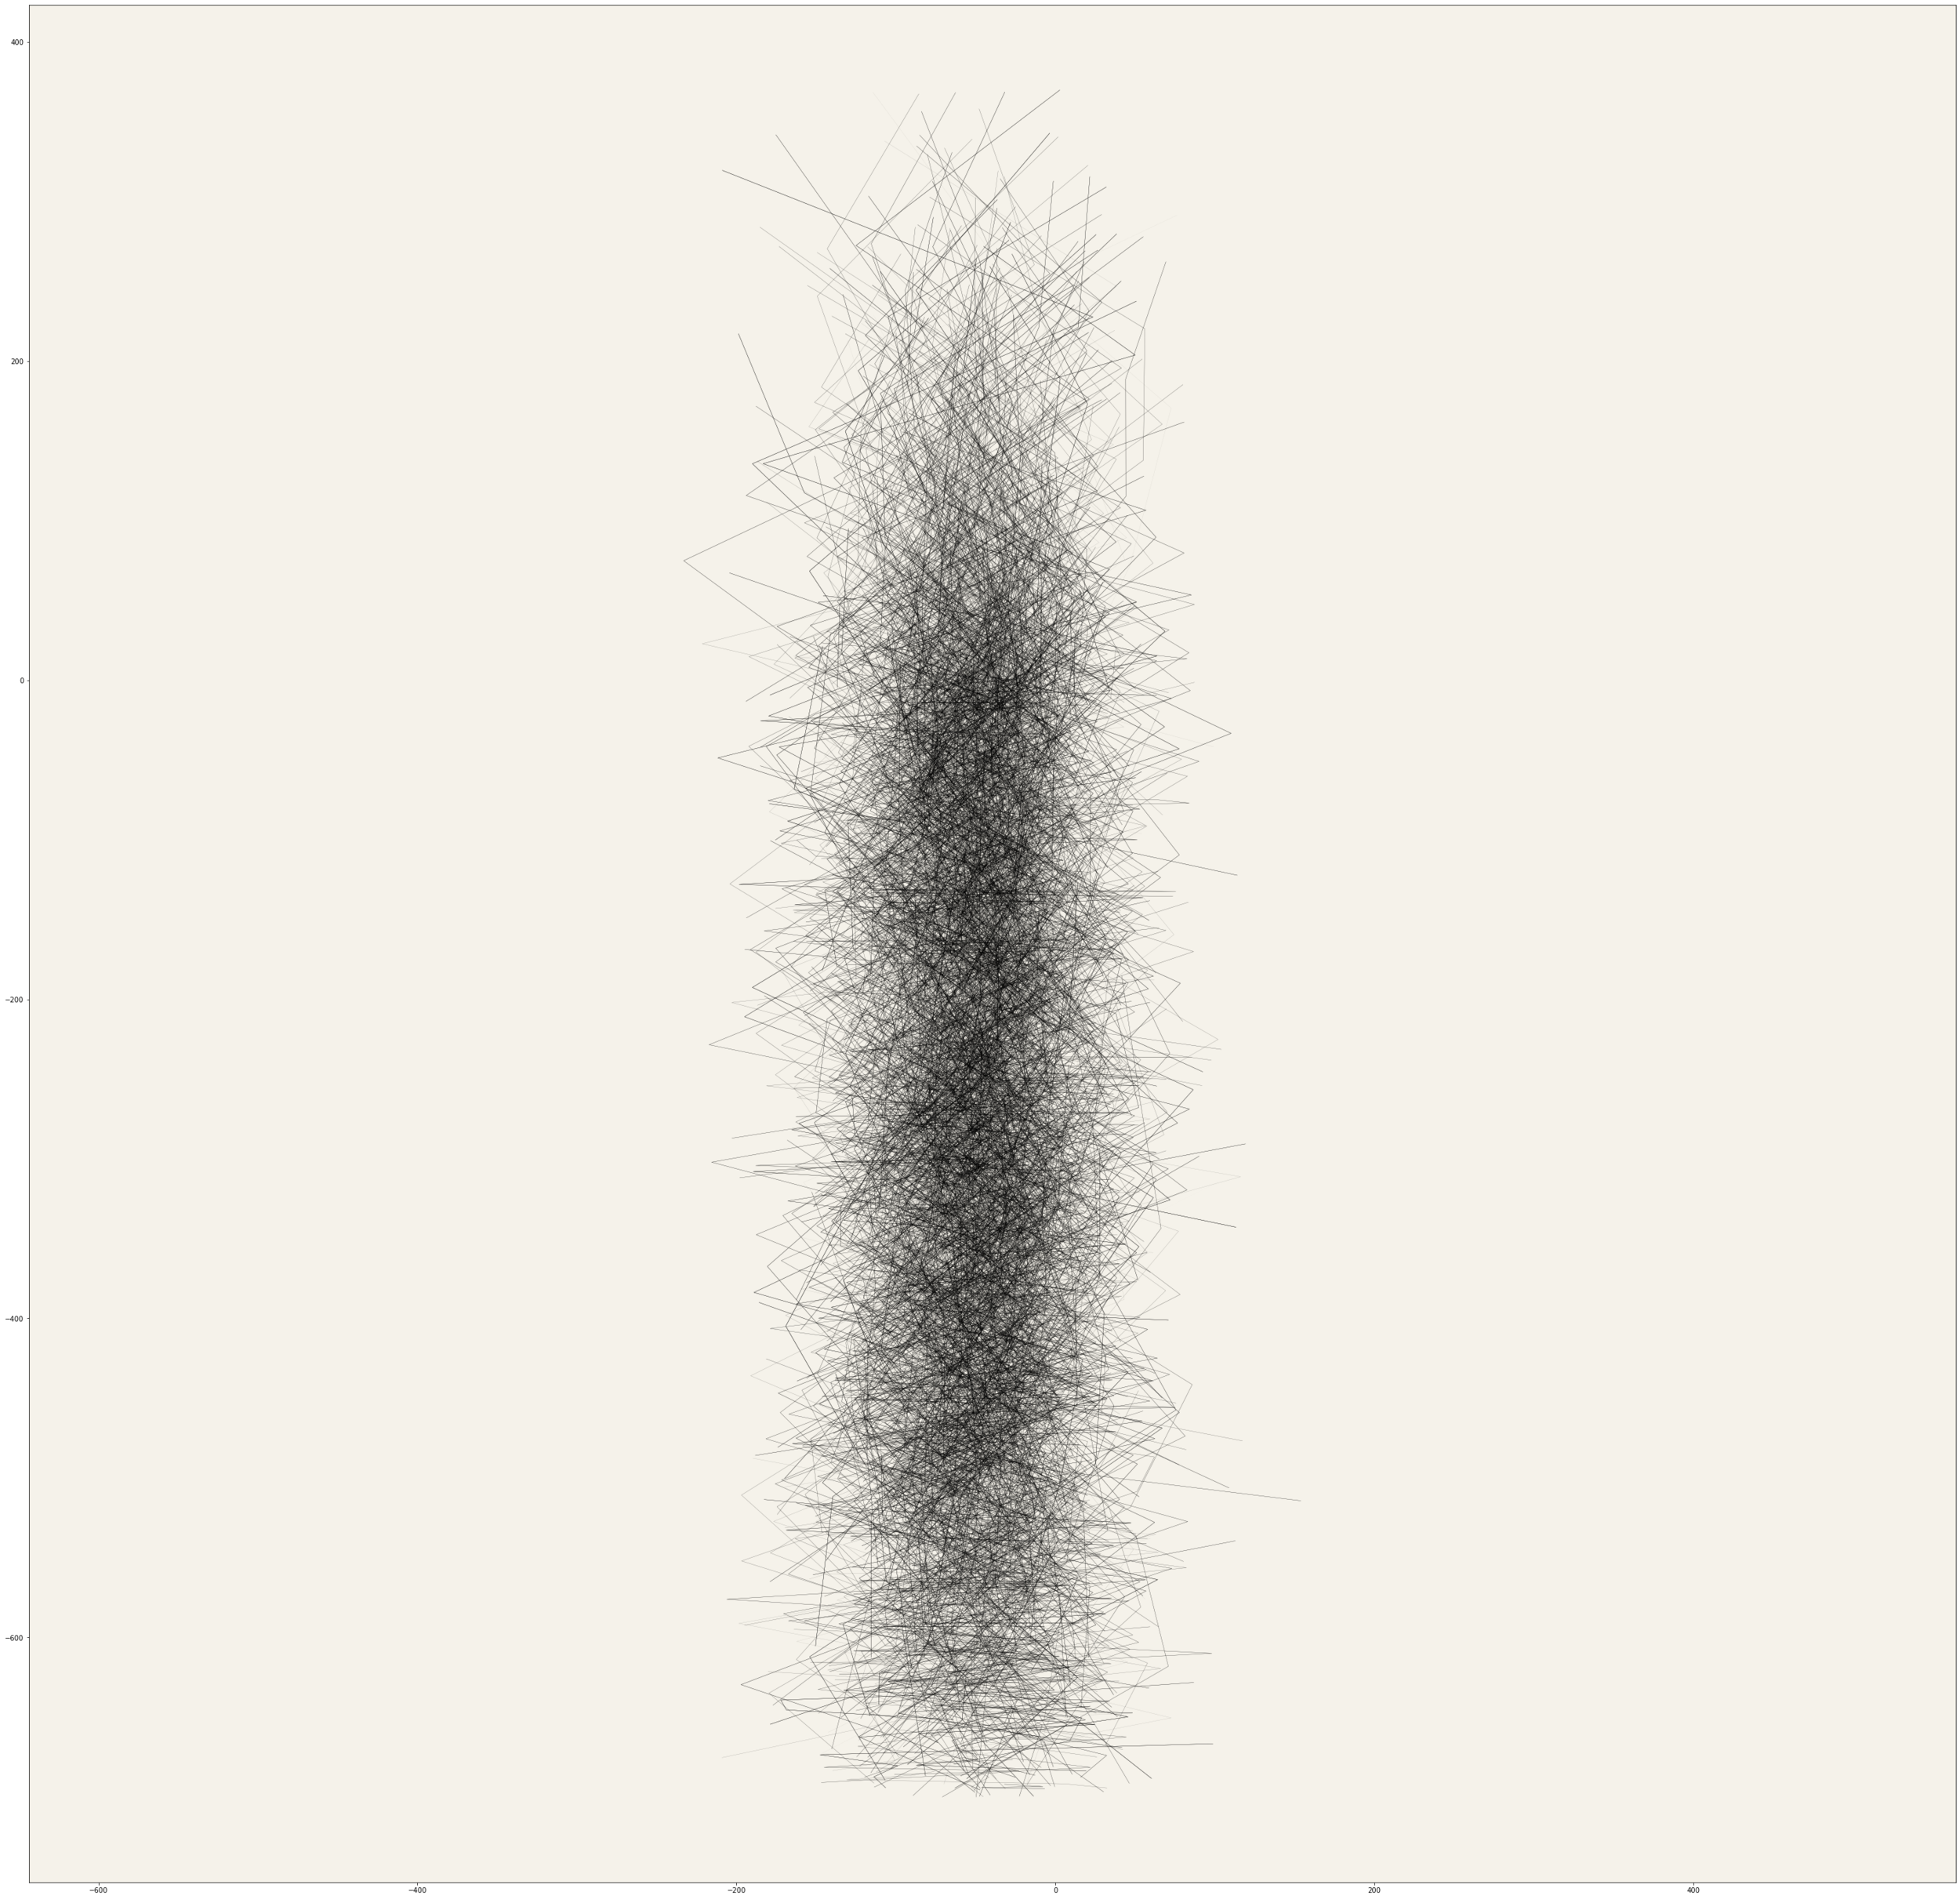
"""
~The Jellyfish code ~ first Python exercise ~
"""

###LINES FAMILY###
#straight vertical white line, with variation in transparency

def draw_line_straight(x,y,length):

    linepointsx=[]
    linepointsy=[]
    linepointsy2=[]
    for j in range (5):
        linepointsx.append(0+x)
        linepointsy.append(length*j+y)
        linepointsy2.append(-1*(length*j+y))

    plt.plot (linepointsx, linepointsy, color=(1,1,1), linewidth=0.3, alpha=r.random())
    plt.plot (linepointsx, linepointsy, color=(1,1,1), linewidth=0.3, alpha=r.random())

###################################
#straight vertical white line, with horizontal "noise" - normal variation x coordinates - using randomness

def draw_line(x,y,length):

    linepointsx=[]
    linepointsy=[]
    linepointsy2=[]

    for j in range (5):
        linepointsx.append(r.normalvariate(-400,400))
        linepointsy.append(length*j+y)
        linepointsy2.append(-1*(length*j+y))

    plt.plot (linepointsx, linepointsy, color=('#FFFFFF'), linewidth=0.3, alpha=r.uniform(0,0.4))
    plt.plot (linepointsx, linepointsy2, color=('#FFFFFF'), linewidth=0.3, alpha=r.random())

##CIRCLES FAMILY##
#NORMAL CIRCLE DEFINITION#
def draw_circle(radius,center_x,center_y, resolution, color_1, alpha_1):

    x,y=[],[]
    n=resolution
    c=color_1
    a=alpha_1

    for i in range (n):
        theta=math.radians(360)*(i/n) #remapfrom [0, n-1] to [0, radians(360)]
        x.append((math.cos(theta)*radius) + center_x)
        y.append((math.sin(theta)*radius) + center_y)

    #add first point in the end to close the line
    x.append(x[0])
    y.append(y[0])
    plt.plot(x,y,color=c, alpha=a)

#Draw circles around circle with exponentially changin radius x[i], x[i]
def draw_megacircle(xshift,yshift,n,radius):
    x=[]
    y=[]
    #n=90
    #radius=70
    for i in range(n):
        theta=math.radians(360)*(i/n)
        x.append((math.cos(theta)*radius))
        y.append((math.sin(theta)*radius))

    for i in range(n):
        draw_circle(radius=x[i],center_x=x[i]+xshift,center_y=y[i]+yshift,resolution=40, color_1=(0,0,i/n), alpha_1=0.8)


def jellyfishgas():
    """DRAWING THE WHITE LINES ON THE BOTTOM OF THE JELLYFISH"""
    k=1
    if k==1:

    #CREATES STRAIGHT LINES WHEN TRUE - FIRST PART OF THE GIF
        for i in range (50):
            for j in range (15):
            draw_line_straight(600*r.random(),-700*r.random(),100*r.random())
                draw_line_straight(-600*r.random(),-700*r.random(),100*r.random())
    else:
    #CREATES RANDOM SPREAD LINES WHEN FALSE - SECOND PART OF THE GIF

        for i in range (20):
            for j in range (17):
                draw_line(200*r.random(),-700*r.random(),200*r.random())
                draw_line(-200*r.random(),+700*r.random(),200*r.random())


@interact(et_x= widgets.IntSlider(min=0, max=10, step=1, value=1),
          et_y= widgets.IntSlider(min=0, max=10, step=1, value=1),
          eb_x= widgets.IntSlider(min=0, max=10, step=1, value=7),
          eb_y= widgets.IntSlider(min=0, max=10, step=1, value=1),
          flytop= widgets.IntSlider(min=0, max=1000, step=100, value=0),
          flybottom= widgets.IntSlider(min=0, max=1000, step=100, value=0))

#     #ELLEIPSE FACTOR FOR TOP PART#
#     et_x   = ellipse top x
#     et_y

#     #ELLEIPSE FACTOR FOR BOTTOM PART#
#     eb_x = ellipse bottom x
#     eb_y

#     #POSITION Y OF TOP OF JELLYFISH
#     flytop = position in x

#     #POSITION Y OF BOTTOM OF JELLYFISH
#     flybottom = position in y


def jellyfish (et_x, et_y, eb_x, eb_y, flytop, flybottom):

    #SETTING BACKGROUND
    fig1, ax=plt.subplots(1, figsize=(50,50))
    ax=plt.axes (xlim=(-1000,1000), ylim=(-1000,1000))
    ax.set_facecolor('#002fa7')
#     ####MAKING THE JELLYFISH######


    #CREATING AN EXPONENTIALLY NUMBER CHANGING LIST TO USE FOR THE JELLYFISH ARRAY
    x=[]
    y=[]
    n=48
    radius=100

    jellyfishgas()

    for i in range(n):
        theta=math.radians(360)*(i/n)
        x.append((math.cos(theta)*radius))
        y.append((math.sin(theta)*radius ))

    for i in range (n):
        #TOP PART OF JELLYFISH
        draw_megacircle(et_x *x[i], et_y* y[i]+100+ flytop ,90,80)

        #BOTTOM PART OF JELLYFISH
        draw_megacircle(eb_x *x[i],eb_y* y[i] +flybottom ,90,70)